Data visualisation: New York City’s daily greenhouse gas emissions
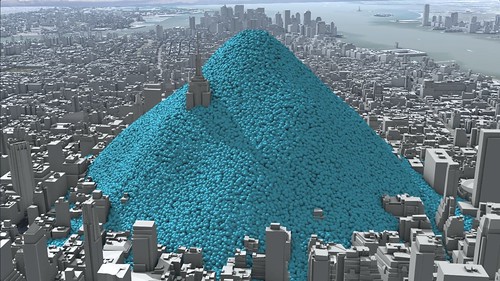
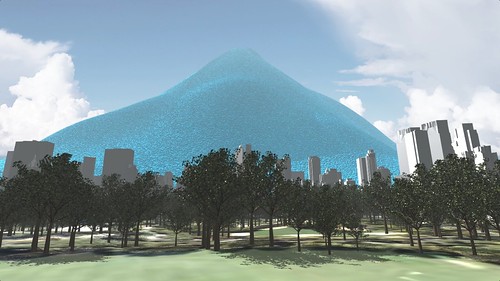
The research team at Carbon Visuals has created this compelling 3D animation, which explores the scale and rate of atmospheric pollution, in real-time, in the City of New York.
I think you'll agree that the illusion of an apocalyptic outcome to this data-driven story is a potent — if not somewhat phantasmagoric — reminder of our commitment to reduce carbon emissions.
View summary of data.
Did you know climate change has so far failed to get a mention in the current US presidential debates? — the first time in 24 years!
(via Guardian Datastore and Carbon Visuals)